SL Paper 3
Data from distant galaxies are shown on the graph.
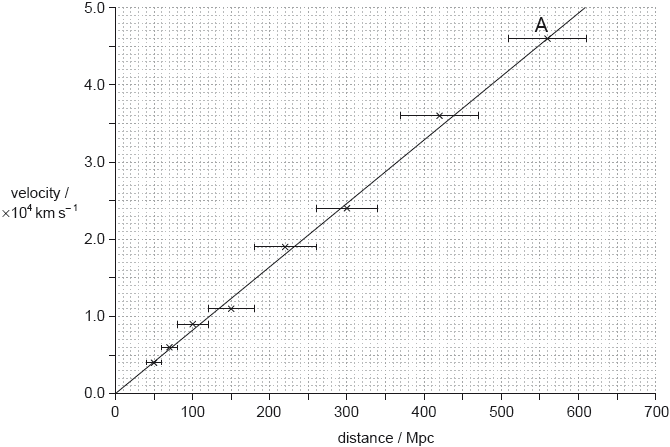
Estimate, using the data, the age of the universe. Give your answer in seconds.
Identify the assumption that you made in your answer to (a).
On the graph, one galaxy is labelled A. Determine the size of the universe, relative to its present size, when light from the galaxy labelled A was emitted.
Distinguish between the solar system and a galaxy.
Distinguish between a planet and a comet.
Theta 1 Orionis is a main sequence star. The following data for Theta 1 Orionis are available.
| Luminosity | L = 4 × 10⁵ L\(_ \odot \) |
| Radius | R = 13R\(_ \odot \) |
| Apparent brightness | b = 4 × 10–11 b\(_ \odot \) |
where L\(_ \odot \), R\(_ \odot \) and b\(_ \odot \) are the luminosity, radius and apparent brightness of the Sun.
State what is meant by a main sequence star.
Show that the mass of Theta 1 Orionis is about 40 solar masses.
The surface temperature of the Sun is about 6000 K. Estimate the surface temperature of Theta 1 Orionis.
Determine the distance of Theta 1 Orionis in AU.
Discuss how Theta 1 Orionis does not collapse under its own weight.
The Sun and Theta 1 Orionis will eventually leave the main sequence. Compare and contrast the different stages in the evolution of the two stars.
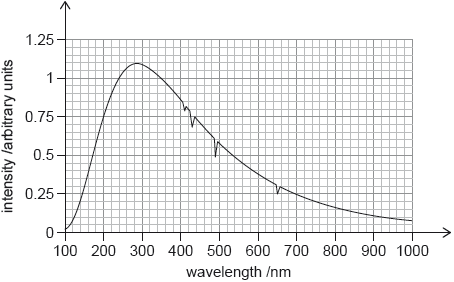
The graph shows the observed spectrum from star X.
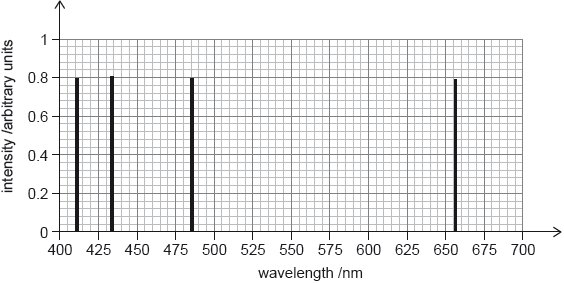
The second graph shows the hydrogen emission spectrum in the visible range.
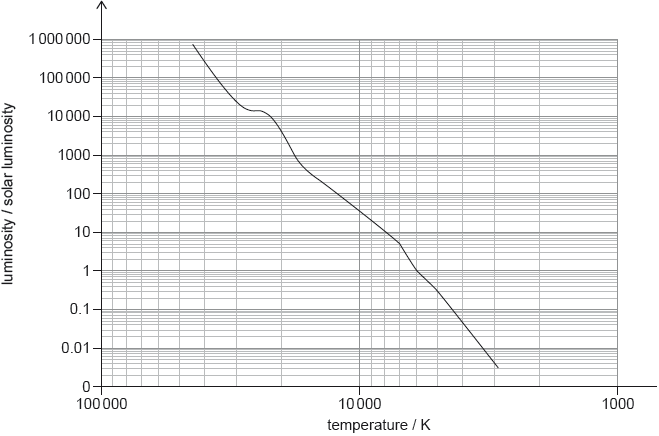
The following diagram shows the main sequence.
Suggest, using the graphs, why star X is most likely to be a main sequence star.
Show that the temperature of star X is approximately 10 000 K.
Write down the luminosity of star X (LX) in terms of the luminosity of the Sun (Ls).
Determine the radius of star X (RX) in terms of the radius of the Sun (Rs).
Estimate the mass of star X (MX) in terms of the mass of the Sun (Ms).
Star X is likely to evolve into a stable white dwarf star.
Outline why the radius of a white dwarf star reaches a stable value.
This question is about the density of the universe.
Explain, with reference to the possible fate of the universe, the significance of the critical density of matter in the universe.
Suggest one reason why it is difficult to estimate the density of matter in the universe.
A particular emission line in a distant galaxy shows a redshift z = 0.084.
The Hubble constant is H0 = 68 km s–1 Mpc–1.
Describe what is meant by the Big Bang model of the universe.
State two features of the cosmic microwave background (CMB) radiation which are consistent with the Big Bang model.
Determine the distance to the galaxy in Mpc.
Describe how type Ia supernovae could be used to measure the distance to this galaxy.
A spectral line in the light received from a distant galaxy shows a redshift of z = 0.16.
State two characteristics of the cosmic microwave background (CMB) radiation.
The present temperature of the CMB is 2.8 K. Calculate the peak wavelength of the CMB.
Describe how the CMB provides evidence for the Hot Big Bang model of the universe.
Determine the distance to this galaxy using a value for the Hubble constant of H0 = 68 km s–1\(\,\)Mpc–1.
Estimate the size of the Universe relative to its present size when the light was emitted by the galaxy in (c).
The Hubble constant is accepted to be 70 km s–1 Mpc–1. This value of the Hubble constant gives an age for the universe of 14.0 billion years.
The accepted value of the Hubble constant has changed over the past decades.
The redshift of a galaxy is measured to be z = 0.19.
Explain how international collaboration has helped to refine this value.
Estimate, in Mpc, the distance between the galaxy and the Earth.
Determine, in years, the approximate age of the universe at the instant when the detected light from the distant galaxy was emitted.
This question is about determining the distance to a nearby star.
Two photographs of the night sky are taken, one six months after the other. When the photographs are compared, one star appears to have shifted from position A to position B, relative to the other stars.
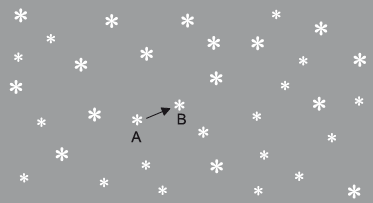
The observed angular displacement of the star is \(\theta \) and the diameter of the Earth’s orbit is \(d\). The distance from the Earth to the star is \(D\).
Outline why the star appears to have shifted from position A to position B.
Draw a diagram showing \(d\), \(D\) and \(\theta \).
Explain the relationship between \(d\), \(D\) and \(\theta \).
One consistent set of units for \(D\) and \(\theta \) are parsecs and arc-seconds. State one other consistent set of units for this pair of quantities.
Suggest whether the distance from Earth to this star can be determined using spectroscopic parallax.
This question is about the Big Bang model and red-shift.
In the 1960s, Penzias and Wilson discovered a uniform cosmic background radiation (CMB) in the microwave region of the electromagnetic spectrum.
Describe what is meant by the Big Bang model.
(i) Explain how the CMB is consistent with the Big Bang model.
(ii) State why the red-shift of light from galaxies supports the Big Bang model.
The collision of two galaxies is being studied. The wavelength of a particular spectral line from the galaxy measured from Earth is 116.04 nm. The spectral line when measured from a source on Earth is 115.00 nm.
Outline one reason for the difference in wavelength.
Determine the velocity of the galaxy relative to Earth.
This question is about the development of the universe.
Light from distant galaxies, as seen by an observer on Earth, shows a red-shift. Outline why this observation suggests that the universe is expanding.
The future development of the universe is determined by the relationship between the apparent density of the universe and the critical density.
(i) Define the term critical density.
(ii) Discuss how the density of the universe determines its future development. Your discussion should include one problem associated with determining the density of the universe.
This question is about the night sky.
Distinguish between a stellar cluster and a constellation.
This question is about objects in the universe.
State one difference between
(i) a main sequence star and a planet.
(ii) a stellar cluster and a constellation.
State how
(i) it is known that main sequence stars are made predominantly of hydrogen.
(ii) a main sequence star remains in equilibrium despite it having a great mass.
The graph shows the variation with wavelength of the intensity of a main sequence star.
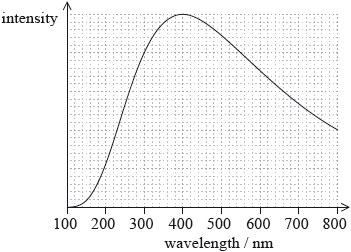
Calculate the surface temperature of this star.
Light reaching Earth from quasar 3C273 has z=0.16.
(i) Outline what is meant by z.
(ii) Calculate the ratio of the size of the universe when the light was emitted by the quasar to the present size of the universe.
(iii) Calculate the distance of 3C273 from Earth using Ho=68kms−1Mpc−1.
Explain how cosmic microwave background (CMB) radiation provides support for the Hot Big Bang model.
This question is about Cepheid stars.
A Cepheid star and non-Cepheid star both belong to the same distant galaxy. Explain, stating the quantities that need to be measured, how the luminosity of the non-Cepheid star may be determined.
The peak wavelength of the cosmic microwave background (CMB) radiation spectrum corresponds to a temperature of 2.76 K.
Identify two other characteristics of the CMB radiation that are predicted from the Hot Big Bang theory.
A spectral line in the hydrogen spectrum measured in the laboratory today has a wavelength of 21cm. Since the emission of the CMB radiation, the cosmic scale factor has changed by a factor of 1100. Determine the wavelength of the 21cm spectral line in the CMB radiation when it is observed today.
Describe one key characteristic of a nebula.
Beta Centauri is a star in the southern skies with a parallax angle of 8.32×10⁻³ arc-seconds. Calculate, in metres, the distance of this star from Earth.
Outline why astrophysicists use non-SI units for the measurement of astronomical distance.
This question is about comets.
Outline the nature of a comet.
This question is about the expanding universe.
Since 1929 it has been thought that the universe is expanding.
State what is meant by the expansion of the universe.
Red-shift of light from distant galaxies provides evidence for an expanding universe.
(i) State one other piece of evidence in support of an expanding universe.
(ii) Explain how your answer in (b)(i) is evidence for the Big Bang model of the universe.
Aldebaran is a red giant star with a peak wavelength of 740 nm and a mass of 1.7 solar masses.
Show that the surface temperature of Aldebaran is about 4000 K.
The radius of Aldebaran is 3.1×10¹⁰ m. Determine the luminosity of Aldebaran.
Outline how the light from Aldebaran gives evidence of its composition.
Identify the element that is fusing in Aldebaran’s core at this stage in its evolution.
Predict the likely future evolution of Aldebaran.
This question is about cosmology.
State how the observed red-shift of many galaxies is explained.
Explain how the cosmic microwave background (CMB) radiation is consistent with the Big Bang model.
Calculate the temperature of the universe when the peak wavelength of the CMB was equal to the wavelength of red light (7.0×10⁻⁷m).
This question is about some of the properties of the star Aldebaran and also about galactic distances.
Aldebaran is a red giant star in the constellation of Taurus.
(i) Describe the differences between a constellation and a stellar cluster.
(ii) Define the luminosity of a star.
(iii) The apparent brightness of Aldebaran is 3.3 ×10⁻⁸ W m–2 and the luminosity of the Sun is 3.9 ×1026 W. The luminosity of Aldebaran is 370 times that of the Sun. Show that Aldebaran is at a distance of 19 pc from Earth. (1 pc=3.1 × 10¹⁶ m)
Distances to galaxies may be determined by using Cepheid variable stars.
By considering the nature and properties of Cepheid variable stars, explain how such stars are used to determine galactic distances.
This question is about cosmology.
Theoretical studies indicate that the universe may be open, closed or flat.
(i) State, by reference to critical density, the condition that must be satisfied for the universe to be flat.
(ii) In a flat universe, the rate of expansion would be slowing down. Suggest a reason for this.
(iii) Outline why it has been difficult to determine whether the universe is open, closed or flat.
Outline one piece of experimental evidence that supports the fact that the universe is expanding.
This question is about cosmology.
Newton assumed that the universe was infinite, uniform and static. The Big Bang model suggests space and time originated at one point around 14 billion years ago. At this time the temperature was very high.
In 1965, Penzias and Wilson discovered cosmic radiation with a wavelength that corresponded to a temperature of around 3 K. Outline how cosmic radiation in the microwave region is consistent with the Big Bang model.
This question is about variable stars and supernovae.
Cepheid variable stars are used as “standard candles” by astronomers.
(i) State what is meant by a standard candle.
(ii) Outline the properties of a Cepheid star that allow it to be used as a standard candle.
(iii) Explain how astronomers use their observations of a Cepheid star to determine the distance from the star to Earth.
This question is about cosmic microwave background (CMB) radiation.
One of Newton’s assumptions was that the universe is static. The peak intensity of the cosmic microwave background (CMB) radiation has a wavelength of 1.06 mm.
Show that this corresponds to a temperature around 3 K.
Suggest how the discovery of the CMB in the microwave region contradicts Newton’s assumption of the static universe.
This question is about the characteristics of the stars Procyon A and Procyon B.
The stars Procyon A and Procyon B are both located in the same stellar cluster in the constellation Canis Minor. Distinguish between a constellation and a stellar cluster.
Constellation:
Stellar cluster:
This question is about a particular star called Barnard’s star.
The peak wavelength in the spectrum of Barnard’s star is 940 nm. The following data are available.
\[\frac{{{\text{apparent brightness of Barnard's star}}}}{{{\text{apparent brightness of the Sun}}}} = 2.5 \times {10^{ - 14}}\]
\[\frac{{{\text{luminosity of Barnard's star}}}}{{{\text{luminosity of the Sun}}}} = 3.8 \times {10^{ - 3}}\]
(i) Show that the surface temperature of Barnard’s star is about 3000 K.
(ii) Suggest why Barnard’s star is not likely to be either a white dwarf or a red giant.
(i) Determine, in astronomical units (AU), the distance between Earth and Barnard’s star.
(ii) Calculate the parallax angle for Barnard’s star as observed from Earth.
(iii) Outline how the parallax angle is measured.
This question is about the cosmic microwave background (CMB) radiation.
State two characteristics of the cosmic microwave background (CMB) radiation.
1.
2.
Explain how CMB radiation is evidence for the Big Bang model of an expanding universe.
This question is about stellar radiation and stellar types.
Alnilam and Bellatrix are two stars in the constellation of Orion. The table gives information on each of these stars. \({L_ \odot }\) is the luminosity of the Sun and \({R_ \odot }\) is the radius of the Sun.
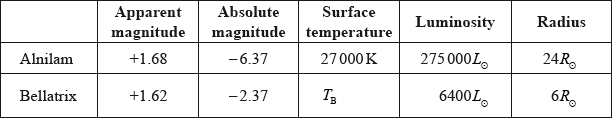
Using a telescope based on Earth, an observer estimates the distance to Alnilam using the stellar parallax method.
Describe the stellar parallax method.
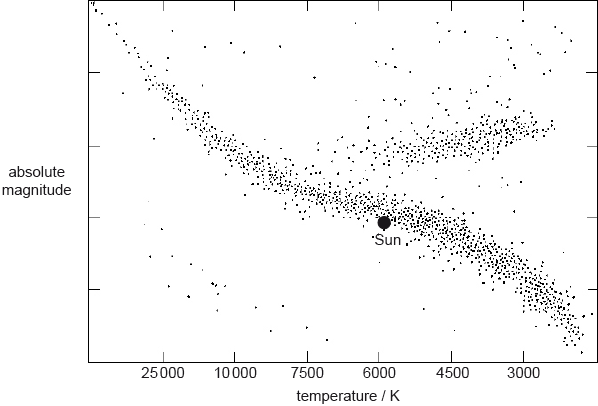
This question is about the Hertzsprung–Russell (HR) diagram and the Sun.
A Hertzsprung–Russell (HR) diagram is shown.
The following data are given for the Sun and a star Vega.
Luminosity of the Sun \( = 3.85 \times {10^{26}}{\text{ W}}\)
Luminosity of Vega \( = 1.54 \times {10^{28}}{\text{ W}}\)
Surface temperature of the Sun \( = 5800{\text{ K}}\)
Surface temperature of Vega \( = 9600{\text{ K}}\)
Determine, using the data, the radius of Vega in terms of solar radii.
Outline how observers on Earth can determine experimentally the temperature of a distant star.
This question is about the development of the universe.
Define, with reference to the flat model of the universe, critical density.
The diagram represents how the universe might develop if its density were greater than the critical density.

The dotted line represents the development of the universe if the density of the universe were zero.
On the diagram above,
(i) label with the letter N the present time.
(ii) draw a line labelled F to represent the development of the universe corresponding to a flat universe.
(iii) draw a line labelled O to represent the development of the universe corresponding to the universe if its density were less than the critical density.
The diagram shows the structure of a typical main sequence star.

Star X is likely to evolve into a neutron star.
State the most abundant element in the core and the most abundant element in the outer layer.

The Hertzsprung–Russell (HR) diagram shows two main sequence stars X and Y and includes lines of constant radius. R is the radius of the Sun.
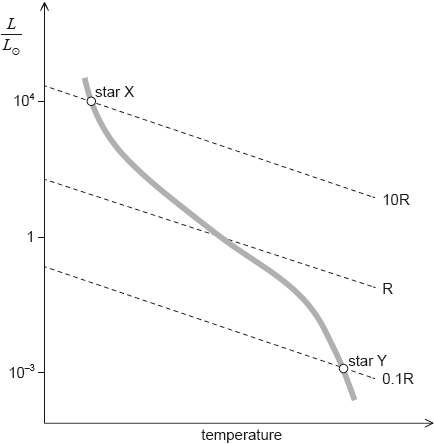
Using the mass–luminosity relation and information from the graph, determine the ratio \(\frac{{{\text{density of star X}}}}{{{\text{density of star Y}}}}\).
On the HR diagram in (b), draw a line to indicate the evolutionary path of star X.
Outline why the neutron star that is left after the supernova stage does not collapse under the action of gravitation.
The radius of a typical neutron star is 20 km and its surface temperature is 106 K. Determine the luminosity of this neutron star.
Determine the region of the electromagnetic spectrum in which the neutron star in (c)(iii) emits most of its energy.
This question is about the life history of stars.
Outline, with reference to pressure, how a star on the main sequence maintains its stability.
The following data apply to the star Gacrux.
\[\begin{array}{*{20}{l}}
{{\text{Radius}}}&{ = 58.5 \times {{10}^9}{\text{ m}}} \\
{{\text{Temperature}}}&{ = 3600{\text{ K}}} \\
{{\text{Distance}}}&{ = 88{\text{ ly}}}
\end{array}\]
A Hertzsprung–Russell (HR) diagram is shown.

On the HR diagram,
Main sequence stars are in equilibrium under the action of forces. Outline how this equilibrium is achieved.
A main sequence star P, is 1.3 times the mass of the Sun. Calculate the luminosity of P relative to the Sun.
The luminosity of the Sun L\(_ \odot \) is 3.85 × 1026 W. Determine the luminosity of Gacrux relative to the Sun.
The distance to Gacrux can be determined using stellar parallax. Outline why this method is not suitable for all stars.
draw the main sequence.
plot the position, using the letter P, of the main sequence star P you calculated in (b).
plot the position, using the letter G, of Gacrux.
Discuss, with reference to its change in mass, the evolution of star P from the main sequence until its final stable phase.
The first graph shows the variation of apparent brightness of a Cepheid star with time.

The second graph shows the average luminosity with period for Cepheid stars.

Determine the distance from Earth to the Cepheid star in parsecs. The luminosity of the Sun is 3.8 × 1026 W. The average apparent brightness of the Cepheid star is 1.1 × 10⁻⁹ W m–2.
Explain why Cephids are used as standard candles.
This question is about the properties of a star.
The peak in the radiation spectrum of a star X is at a wavelength of 300 nm.
Show that the surface temperature of star X is about 10000 K.
The radius of star X is 4.5 RS where RS is the radius of the Sun. The surface temperature of the Sun is 5.7×10³ K.
Determine the ratio \(\frac{{{\rm{luminosity of star X}}}}{{{\rm{luminosity of the Sun}}}}\).
On the Hertzsprung–Russell diagram, label the position of star X with the letter X.

This question is about the Hertzsprung–Russell (HR) diagram and using it to determine some properties of stars.
The diagram below shows the grid of a HR diagram, on which the positions of selected stars are shown. (LS = luminosity of the Sun.)

(i) Draw a circle around the stars that are red giants. Label this circle R.
(ii) Draw a circle around the stars that are white dwarfs. Label this circle W.
(iii) Draw a line through the stars that are main sequence stars.
Explain, without doing any calculation, how astronomers can deduce that star B has a larger diameter than star A.
Using the following data and information from the HR diagram, show that star A is at a distance of about 800 pc from Earth.
Apparent brightness of the Sun =1.4×10³Wm−2
Apparent brightness of star A = 4.9×10⁻⁹Wm−2
Mean distance of Sun from Earth =1.0 AU
1 pc = 2.1×10⁵AU
Explain why the distance of star A from Earth cannot be determined by the method of stellar parallax.
Alpha Centauri A and B is a binary star system in the main sequence.

State what is meant by a binary star system.
(i) Calculate \(\frac{{{b_{\text{A}}}}}{{{b_{\text{B}}}}} = \frac{{{\text{apparent brightness of Alpha Centauri A}}}}{{{\text{apparent brightness of Alpha Centauri B}}}}\).
(ii) The luminosity of the Sun is 3.8 × 1026 W. Calculate the radius of Alpha Centauri A.
Show, without calculation, that the radius of Alpha Centauri B is smaller than the radius of Alpha Centauri A.
Alpha Centauri A is in equilibrium at constant radius. Explain how this equilibrium is maintained.
A standard Hertzsprung–Russell (HR) diagram is shown.

Using the HR diagram, draw the present position of Alpha Centauri A and its expected evolutionary path.
This question is about stars in the constellation Canis Minor.
(i) Using the data in (c), calculate, in parsecs, the distance from Earth to Gomeisa.
(ii) Gomeisa has a radius four times that of the Sun. Use the data in (c) to show that the ratio
\[\frac{{{\rm{luminosity of Gomeisa}}}}{{{\rm{luminosity of Sun}}}}\]
is about 200.
Gomeisa, Luyten’s star and the Sun are main sequence stars. On the grid of the Hertzsprung–Russell (HR) diagram, identify the position of
(i) Gomeisa, with the letter G.
(ii) Luyten’s star, with the letter L.

Sirius is a binary star. It is composed of two stars, Sirius A and Sirius B. Sirius A is a main sequence star.
The Sun’s surface temperature is about 5800 K.
The image shows a Hertzsprung–Russell (HR) diagram.

The mass of Sirius A is twice the mass of the Sun. Using the Hertzsprung–Russell (HR) diagram,
State what is meant by a binary star.
The peak spectral line of Sirius B has a measured wavelength of 115 nm. Show that the surface temperature of Sirius B is about 25 000 K.
The mass of Sirius B is about the same mass as the Sun. The luminosity of Sirius B is 2.5 % of the luminosity of the Sun. Show, with a calculation, that Sirius B is not a main sequence star.
Determine the radius of Sirius B in terms of the radius of the Sun.
Identify the star type of Sirius B.
draw the approximate positions of Sirius A, labelled A and Sirius B, labelled B.
sketch the expected evolutionary path for Sirius A.
This question is about the star Naos (Zeta Puppis).
The following data are available for the star Naos.
Surface temperature = 4.24×10⁴K
Radius = 7.70×10⁹m
Apparent magnitude = +2.21
Parallax angle = 3.36×10⁻³ arcseconds
The distance to Naos may be determined by the method of stellar parallax. The diagram shows the star Naos and the Earth in its orbit around the Sun.

(i) Draw lines on the diagram above in order to indicate the parallax angle of Naos.
(ii) Outline how the parallax angle of Naos may be measured.
This question is about stars.
The Hertzsprung–Russell (HR) diagram shows the Sun, a star labelled A and the main sequence.

Star A is part of a binary star system. The diagram shows the orbit of star A and the orbit of its companion, star B.

The temperature of star A is TA, the temperature of star B is TB and \(\frac{{{T_A}}}{{{T_B}}} = 0.60\). The radius of star A is RA, the radius of star B is RB and \(\frac{{{R_A}}}{{{R_B}}} = 270\).
Show that the luminosity of star A is 9.4×10³ times greater than the luminosity of star B.
The diagram below shows the spectrum of the stars as observed from Earth. The spectrum shows one line from star A and one line from star B, when the stars are in the position shown in the diagram (b).

On the spectrum draw lines to show the approximate positions of these spectral lines after the stars have completed one quarter of a revolution.
This question is about stellar distances and stellar properties.

On the grid of the Hertzsprung–Russell (HR) diagram shown, draw a line to represent the approximate position of the main sequence.
Barnard’s star is a main sequence star that is 1.8 pc from Earth.
(i) Define the parsec.
(ii) Calculate the parallax angle of Barnard’s star as measured from Earth.
Outline, using your answer to (b)(ii) and a labelled diagram, how the distance of Barnard’s star from Earth is measured.
The apparent brightness of Barnard’s star is 3.6×10⁻¹²Wm–2 and its surface temperature is 3800 K.
Given that 1 pc=3.1×10¹⁶m, show for Barnard’s star
(i) that its luminosity is of the order of 1023W.
(ii) that its surface area is of the order of 1016m2.
This question is about the development of the universe.
The graph shows one possible way in which the universe is thought to change with time. This type of universe is known as a fl at universe.

On the graph, draw lines to show the variation with time of the size of the universe for both a closed universe and an open universe. Label your line for the closed universe C and your line for the open universe O.
Explain how the open and closed outcomes for the universe depend on the critical density of matter in the universe.
State one reason why it is difficult to determine the density of the universe.
This question is about the properties of a star.
Describe what is meant by a
(i) constellation.
(ii) stellar cluster.

On the Hertzsprung–Russell diagram above,
(i) label the position of Betelgeuse with the letter B.
(ii) sketch the position of main sequence stars.
This question is about stars.
The Hertzsprung–Russell (HR) diagram shows the position of the Sun and three stars labelled A, B and C.

State the star type for A, B and C.
Determine the ratio \(\frac{{{\rm{radius of B}}}}{{{\rm{radius of A}}}}\)
The apparent brightness of C is 3.8 \( \times \) 10–10 Wm–2. The luminosity of the Sun is 3.9 \( \times \) 1026 W.
(i) State what is meant by apparent brightness and luminosity.
Apparent brightness:
Luminosity:
(ii) Determine the distance of C from Earth.
The graph shows the variation with wavelength λ of the intensity I of the radiation emitted by 1.0m2 of the surface of the Sun. The curve of the graph has been adjusted so that the maximum intensity is 1.

On the grid, draw a corresponding graph for star C. Your curve should have a maximum intensity of 1.